Lưu ý: 1. Bản tin phân tích trend tăng/giảm mang tính tham khảo 2. Bạn nên kiểm tra tin ra hàng ngày, hàng giờ để tránh rủi ro khi giao dịch ở trang web: http://www.forexfactory.com/calendar.php 3. Tham khảo "Thủ thuật bảo toàn vốn" để hạn chế thua lỗ: https://giavangonline.com/technicaldetail.php?id=59 |
|
Daily and weekly charts are also bullish.
6:49 AM (UTC+7)
Gold may rise to 2400.00 - 2410.00
Pivot 2378.00 Our preference Long positions above 2378.00 with targets at 2400.00 & 2410.00 in extension. Alternative scenario Below 2378.00 look for further downside with 2365.00 & 2354.00 as targets. Comment The RSI shows upside momentum. Supports and resistances 2418.00 2410.00 2400.00 2390.00 Last 2378.00 2365.00 2354.00 Number of asterisks represents the strength of support and resistance levels.
6:52 AM (UTC+7)
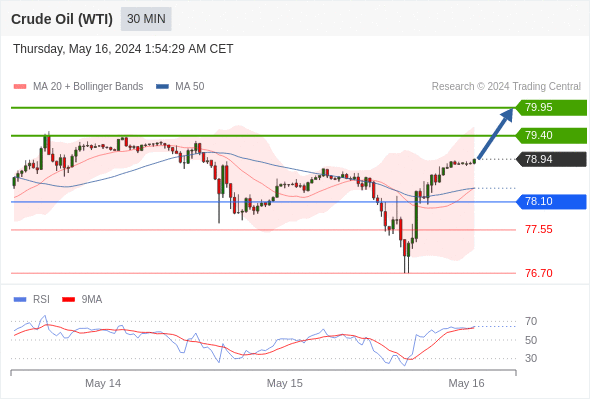
Crude Oil (WTI) may rise to 79.40 - 79.95
Pivot 78.10 Our preference Long positions above 78.10 with targets at 79.40 & 79.95 in extension. Alternative scenario Below 78.10 look for further downside with 77.55 & 76.70 as targets. Comment The RSI shows upside momentum. Supports and resistances 80.45 79.95 79.40 78.94 Last 78.10 77.55 76.70 Number of asterisks represents the strength of support and resistance levels.
6:50 AM (UTC+7)
USD/JPY may fall 50 - 90 pips
Pivot 155.00 Our preference Short positions below 155.00 with targets at 153.80 & 153.40 in extension. Alternative scenario Above 155.00 look for further upside with 155.30 & 155.80 as targets. Comment The RSI has broken down its 30 level. Supports and resistances 155.80 155.30 155.00 154.30 Last 153.80 153.40 153.00 Number of asterisks represents the strength of support and resistance levels.
7:01 AM (UTC+7)
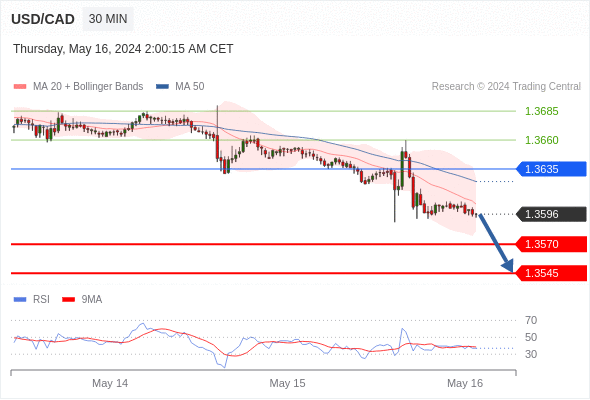
USD/CAD may fall 26 - 51 pips
Pivot 1.3635 Our preference Short positions below 1.3635 with targets at 1.3570 & 1.3545 in extension. Alternative scenario Above 1.3635 look for further upside with 1.3660 & 1.3685 as targets. Comment The RSI calls for a new downleg. Supports and resistances 1.3685 1.3660 1.3635 1.3596 Last 1.3570 1.3545 1.3520 Number of asterisks represents the strength of support and resistance levels.
6:24 AM (UTC+7)
GBP/USD may rise 21 - 46 pips
Pivot 1.2650 Our preference Long positions above 1.2650 with targets at 1.2710 & 1.2735 in extension. Alternative scenario Below 1.2650 look for further downside with 1.2630 & 1.2610 as targets. Comment The RSI is bullish and calls for further upside. Supports and resistances 1.2755 1.2735 1.2710 1.2689 Last 1.2650 1.2630 1.2610 Number of asterisks represents the strength of support and resistance levels.
Daily and weekly charts are also bullish.
6:48 AM (UTC+7)
EUR/USD may rise 21 - 41 pips
Pivot 1.0860 Our preference Long positions above 1.0860 with targets at 1.0910 & 1.0930 in extension. Alternative scenario Below 1.0860 look for further downside with 1.0840 & 1.0820 as targets. Comment The RSI calls for a new upleg. Supports and resistances 1.0945 1.0930 1.0910 1.0889 Last 1.0860 1.0840 1.0820 Number of asterisks represents the strength of support and resistance levels.
6:59 AM (UTC+7)
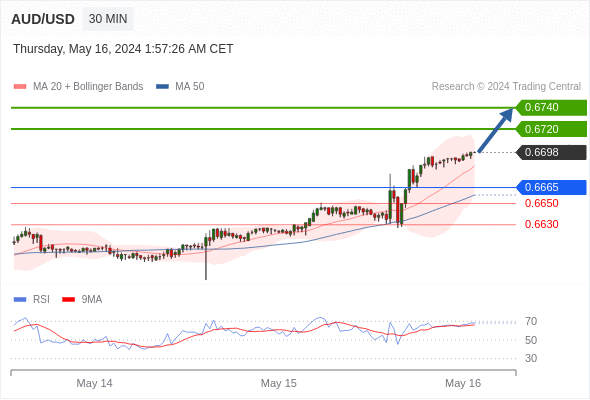
AUD/USD may rise 22 - 42 pips
Pivot 0.6665 Our preference Long positions above 0.6665 with targets at 0.6720 & 0.6740 in extension. Alternative scenario Below 0.6665 look for further downside with 0.6650 & 0.6630 as targets. Comment The RSI calls for a bounce. Supports and resistances 0.6760 0.6740 0.6720 0.6698 Last 0.6665 0.6650 0.6630 Number of asterisks represents the strength of support and resistance levels. |


